Center for Education Excellence
Reason Foundation: Education Spending in Delaware (Interactive Map)
Dr. Tanya Hettler, Ph.D. | 10/12/2022
The Reason Foundation, a public policy think tank in California, compiled data from the U.S. Census from 2002 to 2020. They have kindly shared their data with the Caesar Rodney Institute and given us access to their interactive map of the country and their various graphs depicting education spending data specific to Delaware.
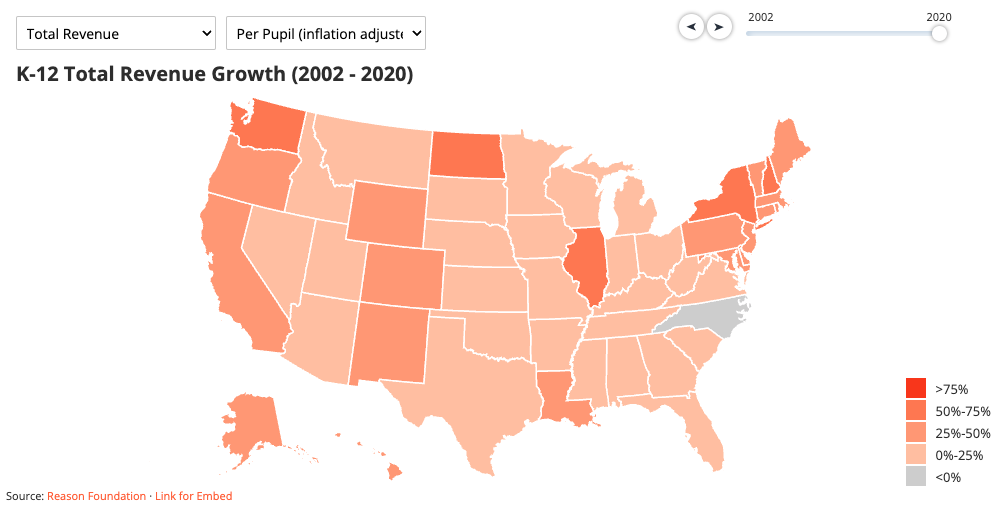
Their summary statement about the national census data concludes: "Nationwide, inflation-adjusted per-pupil K-12 revenues grew by 25%—or by $3,211 per student—between 2002 and 2020. During this time, per-pupil revenues increased in all but one state (North Carolina). Sixteen states, plus D.C., increased their education funding by 30% or more during this time period."
Delaware has the 5th highest increase in spending in the country after:
|
69%
|
|
66%
|
|
54%
|
|
51%
|
|
49%
|
GRAPH 1: K-12 Total Revenue Growth (2002-2020)
(Please click on URL link for interactive graph: https://ss2-map.vercel.app/)
Here is a summary of the 2002-2020 changes in education spending (inflation-adjusted) for the state of Delaware based on the data in the above table:
|
Total Revenue
|
49% increase
|
|
School Administrators
|
27% increase
|
|
General Administrators
|
33% increase
|
|
Overall Administrative spending
|
28% increase
|
|
Enrollment
|
11% increase
|
|
Total Support Services
|
66% increase
|
|
Instruction Spending
|
30% increase
|
|
Teacher Salaries
|
12%
|
|
Teacher Benefits
|
99%
|
The following graphs are relatively self-explanatory. The data shown are by default for Delaware, but if you would like to compare with another state, you can use the drop-down menu at the top left of each graph to choose the data from another state. You will find graphs for revenue split into federal, state, and local monies, salary and benefits for both teachers and support staff, spending for various categories of support staff, amount of debt, and capital outlay.
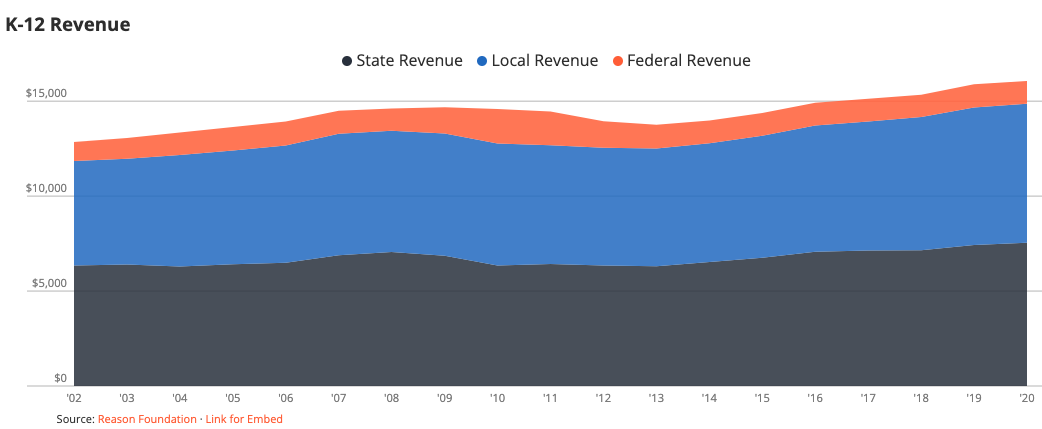
GRAPH 2: K-12 Revenue
(Please click on URL link for interactive graph: https://ss2-revenue.vercel.app/)
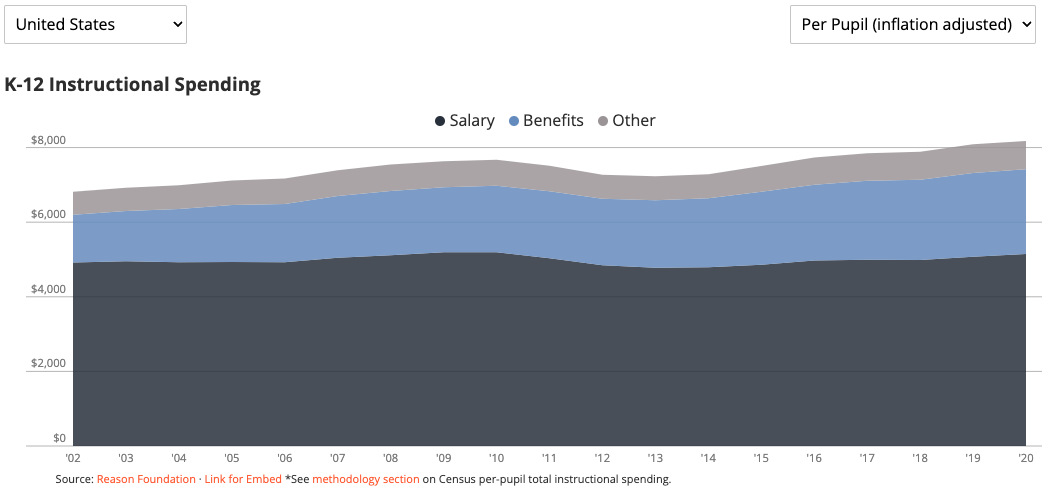
GRAPH 3: K-12 Instructional Spending
(Please click on URL link for interactive graph: https://ss2-instructional.vercel.app/)
GRAPH 4: K-12 Support Services Spending (by object)
(Please click on URL link for interactive graph: https://ss2-support-services-object.vercel.app/)

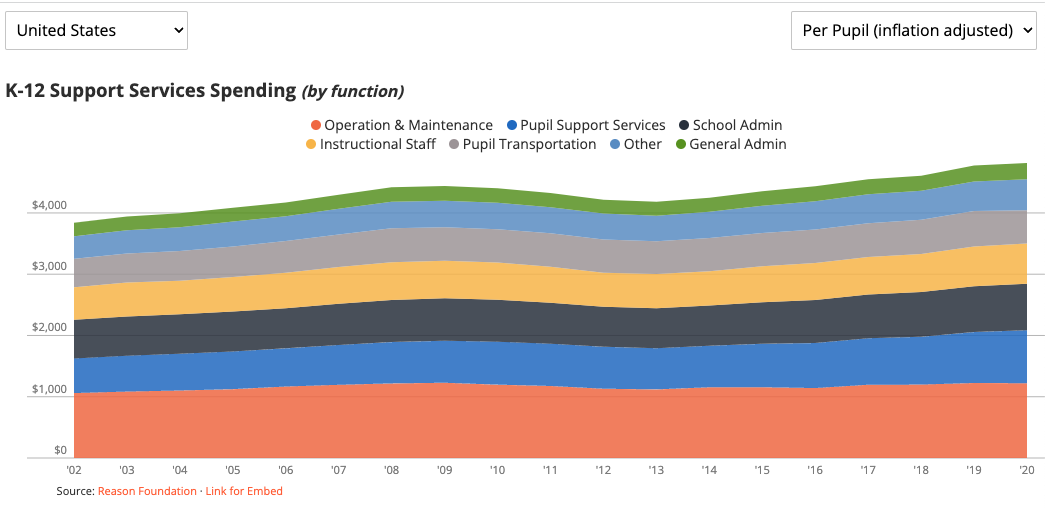
GRAPH 5: K-12 Support Services Spending (by function)
(Please click on URL link for interactive graph: https://ss2-support-services-function.vercel.app/)
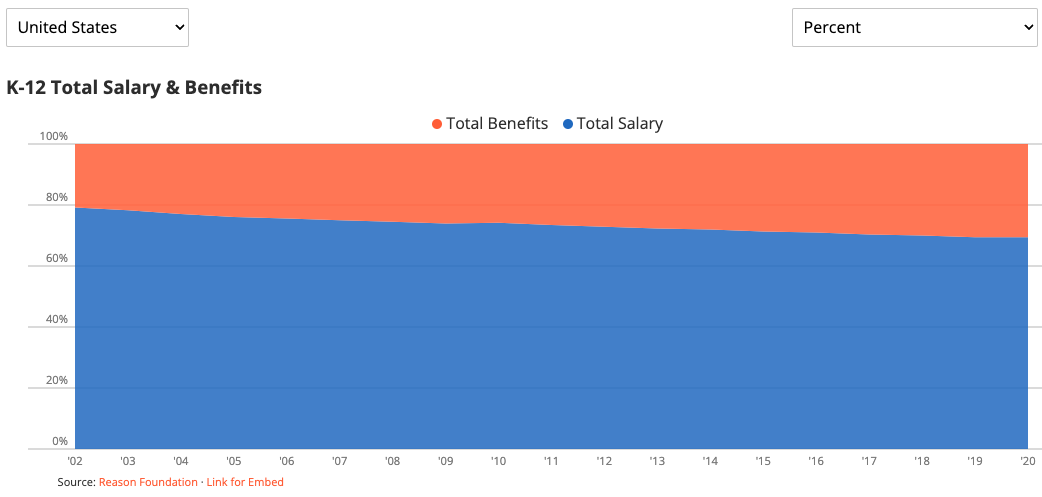
GRAPH 6: K-12 Total Salary & Benefits
(Please click on URL link for interactive graph: https://ss2-total-salary-benefits.vercel.app/)
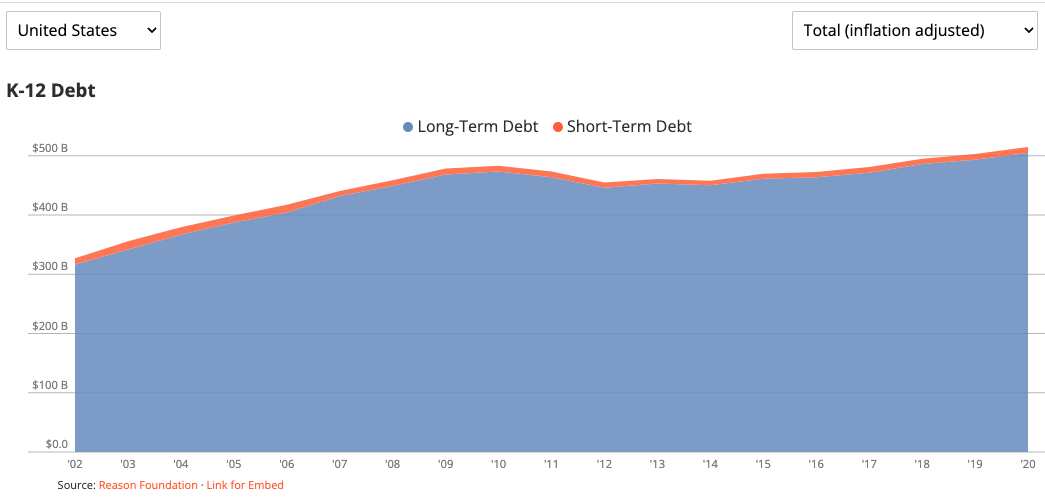
GRAPH 7: K-12 Debt
(Please click on URL link for interactive graph: https://ss2-debt.vercel.app/)
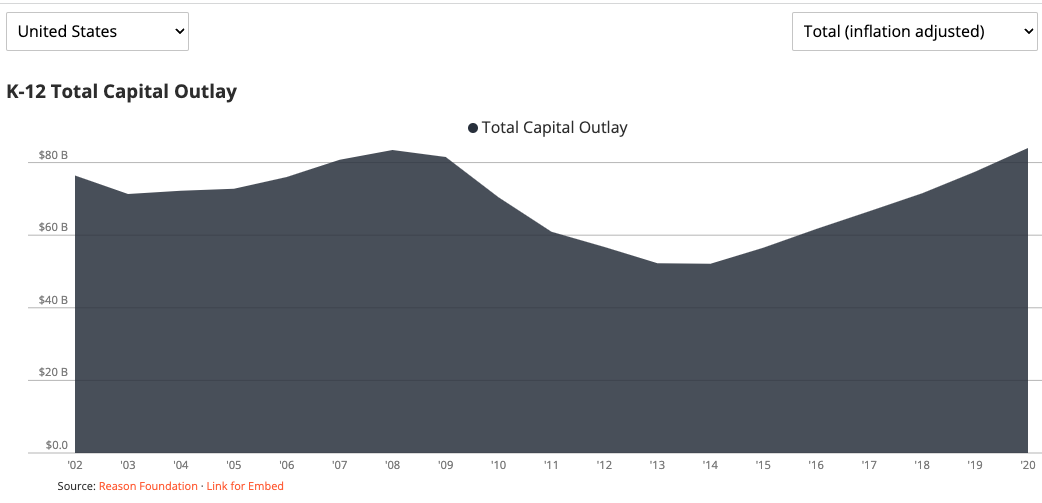
GRAPH 8: K-12 Total Capital Layout
(Please click on URL link for interactive graph: https://ss2-capital-outlay.vercel.app/)
As you look at these expenses, don't forget that DE is one of the 10 worst states in math on the National Assessment of Educational Progress in 2019 (the last pre-COVID data). And Delaware is one of 16 states with lower scores in 2019 on reading than in previous years.
Additionally, according to the state’s reporting, the Delaware State Assessment (DeSSA) results for 2018-2019 (the most recent pre-COVID-19 year), the percentage of students in the state performing at or above grade level is abysmal. For reading, the percentage is 53%, and for math, the percentage is 44%.
The numbers are far worse for 2020 and 2021. A portion of the students only took the 2020 tests, and much of the year was spent in ineffective remote learning, so those data are inaccurate.
For last year, 2021, in English language arts, 42 percent (well below half) of students in grades 3-8 scored at or above their proficiency level. In mathematics, only 30 percent of students (less than a third) in grades 3-8 scored at or above their proficiency level.
As you can see from this data, Delaware is spending well above the national average and performing well below the national average. This is unacceptable. We desperately need systemic change to our education system in Delaware.
The Caesar Rodney Institute continues to provide research-based analysis with solutions to our state and school leaders to improve education in Delaware for all of our students - whether from the city, suburbs, or rural areas, whether wealthy or poor, and regardless of race.
SUBSCRIBE NOW!
Subscribe to receive CRI Policy analysis, updates, and event notifications!
Send a Comment To the Author
Our Mission Statement
The Caesar Rodney Institute is Delaware's Only General Public Policy Organization Committed to Protecting Individual Liberties and Preserving Fiscally Responsible and Efficient Government for the Common Good.